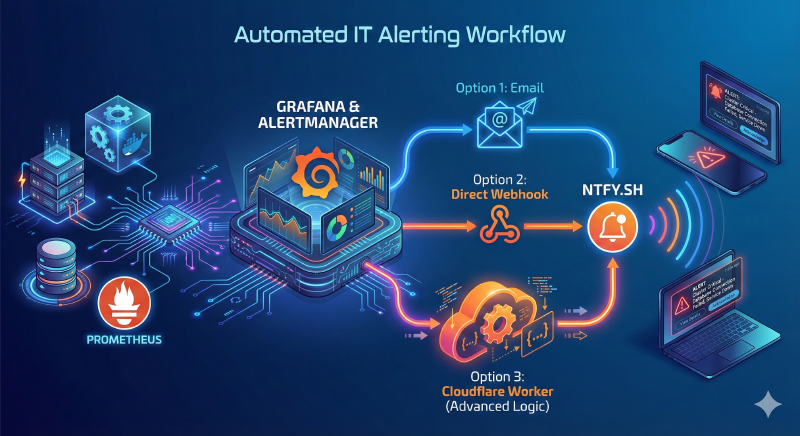
In this post, we’ll explore how to send alerts triggered by Grafana—from the built-in Grafana Alertmanager—to Ntfy. We will look at three different methods: via email, via a standard webhook, and finally, via a Cloudflare Worker, which unlocks far more customization options for your notifications.
❯ Prerequisites
For this guide, I am focusing on a self-hosted instance of Grafana and the public instance of Ntfy, available at ntfy.sh.
❯ Grafana
Grafana is an open-source platform designed to visualize data through modular dashboards and panels, pulling from various data sources.
Grafana comes with a vast ecosystem for collecting metrics, including:
Prometheus: Fetches data from services running on different hosts, Docker data (via cAdvisor), server core metrics via node-exporter, S.M.A.R.T. disk metrics, Postgres, Mongo, etc.
Loki: Handles logs, including system logs, journals, and Docker logs.
Infinity Datasource: Fetches data from various APIs, CSVs, JSON files, etc.
And many others: Google Analytics, Cloudflare, Elasticsearch, GitHub, etc.
I won’t detail the configuration of these components here, as it strongly depends on your specific data and coverage needs. Personally, I use Grafana to visualize core metrics from my servers (memory/CPU usage, I/O, disk usage, temperature), service availability via Blackbox, and Docker container metrics (CPU, memory, network, uptime). I also have dedicated dashboards for Postgres, MongoDB, Traefik, Cloudflare, Plausible Analytics, and my Garage cluster.
The possibilities are almost limitless! The list of native data sources is impressive and can be expanded via plugins from the Grafana catalog. Want to display your Strava metrics? Check out this plugin: Grafana Strava Datasource. Need Jira statistics? There is a plugin for that too: Grafana Jira Datasource. You can browse the full catalog here: Grafana Plugins.
Beyond these specific use cases, the main purpose of these dashboards is to visualize the health of your infrastructure. However, looking at a dashboard doesn’t directly help you detect problematic events immediately (like an API returning a high rate of 5xx errors after a deployment), nor does it help you proactively catch issues (like a memory leak leading to a crash). Unless you dedicate someone on your team—or one of your kids, if this is for a homelab!—to watch these screens all day, relying solely on visual checks is not sustainable in the long term.
The real value lies in investigating dashboards after you have been alerted to a problem. Grafana allows you to define alerts based on your metrics via the Alertmanager. While there are standalone Alertmanager services for Prometheus, Mimir, or Cortex (which offer greater resiliency for enterprise environments), I haven’t experimented with those yet.
In this post, I will focus on the Grafana built-in Alertmanager. In my opinion, it is the easiest way to start with alerting, tailored perfectly for homelabs and teams that want to be autonomous and aware of issues within their scope.
In the “Alerting” section of Grafana, you can create Alert rules that evaluate an expression and trigger an alert if the outcome changes.
Example: I want to watch the health of my Garage cluster. There is a metric, cluster_healthy, which equals 1 when healthy and 0 otherwise. I created an alert rule using the Prometheus datasource for the cluster_healthy metric, with a condition to trigger when the query is below 1. In the “Configure notifications” section, you can set up triggers via email, Jira, Discord, etc., or via Webhook if your solution isn’t listed—which is exactly our case with Ntfy.
❯ Ntfy
To keep it short, Ntfy is free software that allows you to send notifications via API calls or emails to your mobile or desktop devices. Use cases vary widely: getting notified when a backup fails, when a product is back in stock, or forwarding phone notifications to your laptop (for the latter, I recommend checking out the Android app Tasker).
We will use Ntfy to send push notifications when an alert is triggered or resolved.
The public version, accessible at ntfy.sh, offers a generous free tier that is more than enough for our needs (capped at 250 messages per day). A premium tier exists for higher limits and private topics. Alternatively, you can self-host your own Ntfy instance, removing these constraints at the cost of maintaining another service.
I highly recommend reading the comprehensive documentation to understand how it works and see the configuration options.
For the rest of this article, I assume you have created an account on ntfy.sh and subscribed to a topic (click “Subscribe to topic”, generate a name, and save it). Note down this topic name; we will need it shortly.

❯ Option 1. Via webhook
Once your Ntfy topic is ready, setting up a Contact Point in Grafana is straightforward:
- Go to Alerting > Contact points > + Create Contact point.
- In the Integration dropdown, choose Webhook.
- In the URL field, type
https://ntfy.sh/${topic}, replacing${topic}with your Ntfy topic name.

Grafana defines templates that allow access to alert information, which you can use in the notification payload. To do this, we edit the “Custom Payload” field. For example, if you enter:
| |
…and click “Test”, you should receive a notification on Ntfy like this:
| |

I admit, the format isn’t very neat, but it gets the job done.
❯ Option 2. Via email
Sending Ntfy notifications via email requires configuring SMTP in Grafana first. You can find more details here.
I configured mine using a Gmail account. Note that you must create an App Password so Grafana can send emails via your account (see guides here and here).
My SMTP configuration in grafana.ini looks like this:
| |
After updating the config, restart Grafana. Then:
- Go to Alerting > Contact points > + Create Contact point.
- Select Email in the Integration dropdown.
- In the Addresses field, following the Ntfy email publishing docs, add
ntfy-${topic}@ntfy.sh.
Unlike the webhook option, we can easily set a proper title here by updating the Subject field. For example:
| |

However, you lose some control over the message body because Grafana includes default information regardless of what you put in the “Message” field. If left blank, Grafana sends a lot of data, making the notification hard to read. I simply put a single whitespace in the message field so the notification only contains the alert context and status.
The test notification looks like this: Title:
Grafana alert firing
Body:
“1 firing alert instance
📁 Grouped by
alertname=TestAlert
grafana_folder=Test Folder
instance=Grafana
© 20XX Grafana Labs. Sent by Grafana vXX.X.X .”

❯ Option 3. via webhook + CloudFlare worker
❯ Configuring the worker on Cloudflare
The previous two options are easy to set up but come with a drawback: Grafana’s webhook configuration is rigid. Specifically, you cannot easily parameterize headers based on alert data. This limits our ability to:
- Add action buttons (to open a dashboard or trigger a webhook).
- Set priority levels (which affects vibration/sound on the phone).
- Use tags (emojis) to visually distinguish between a firing alert and a resolution.
The strategy here is to add a “middleware” component—a Cloudflare Worker. Grafana sends the full alert payload to the Worker, which processes the logic and constructs the perfect API call to send to Ntfy.
Cloudflare Workers are light, fast to deploy, and perfect for this kind of data transformation. The free tier is more than sufficient.
To create a worker:
- Log in to Cloudflare and go to Compute (Workers) > Create application.
- You can start with “Hello World” or connect to GitHub.
- I personally recommend using a GitHub repository for versioning. You can fork or use my repository here.

Once deployed, we need to define two secrets: AUTH_TOKEN and TOPIC.
- Go to your Worker’s Settings > Variables and Secrets > Add.
- Select Secret. Name it
AUTH_TOKENand generate a long random string (e.g., usingopenssl rand -base64 20in your terminal). Save this token; we’ll need it for Grafana. - Repeat the process for TOPIC, using your Ntfy topic name as the value.

❯ Configuring the Contact Point in Grafana
Back in Grafana:
- Go to Alerting > Contact points > + Create contact point.
- Choose Webhook.
- Enter your Cloudflare Worker URL (ensure you include
https://).
Under Optional Webhook Settings:
- HTTP Method: POST
- Authorization Header Scheme: Bearer
- Authorization Header Credentials: Paste the
AUTH_TOKENyou created in Cloudflare. - Message: Click “Edit Message” > “Enter custom message”. Paste the JSON block below.

Note: This JSON extracts all relevant alert data documented in the Grafana Template Reference. It must remain a valid single-line JSON object.
| |
Click Test and then Send test notification. If everything is configured correctly, your Worker will format the data and send a clean, actionable notification to Ntfy.
❯ Going further
Using a Cloudflare Worker opens up many possibilities compared to direct interaction. We stuck to a simple use case here (changing icons based on firing/resolved status), but you could also:
- Route alerts to different topics based on severity.
- Implement retry logic or fallbacks if Ntfy is down.
- Use Cloudflare Worker KV (storage) to prevent “flapping” alerts (where a metric constantly oscillates around a threshold) by checking if a notification was sent recently.
One final note on security: This guide uses the public version of Ntfy. Since there is no authentication on the topic subscription side, anyone who guesses your topic name can see your notifications. This is generally acceptable for a homelab but not for business environments. For critical data, consider self-hosting Ntfy or upgrading to a paid plan for access control.